Weekly Gold Movement Report – July 27, 2025
Fundamental Analysis:
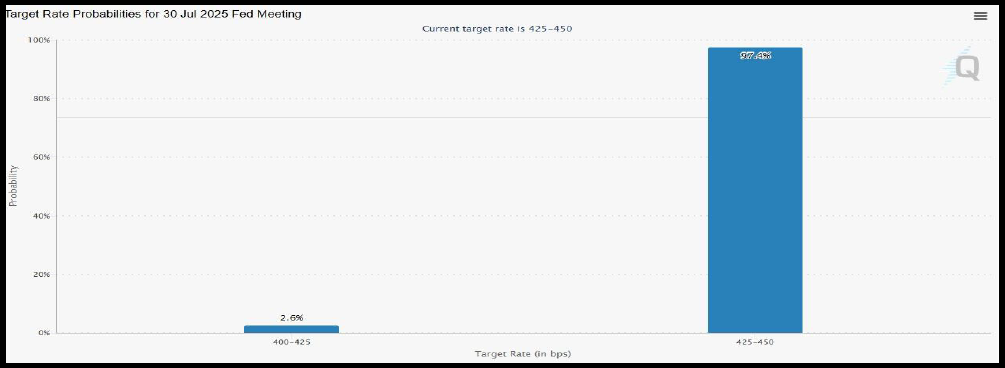
A very strong trading week is expected, with the release of non-farm payroll data, which is a major market mover. This will be followed by the Federal Reserve meeting to decide on interest rates…
Our research department believes that markets are not convinced the Fed will cut interest rates this week. We still maintain our forecast that the first rate cut is likely to occur in September.
Away from market noise, at Gold Era we have taken a different approach — focusing on identifying the fair value of gold rather than getting caught up in sideways movements. The goal is to answer a key question: Are gold prices at their peak or not?
Our answer is that, since gold was fully decoupled from sovereign currencies on August 15, 1971, the metal has experienced three major bull markets:
In the 1970s, in the first decade of the 21st century, and in the current decade.
A comparison of these three major gold bull markets shows that history does not repeat itself, but it does rhyme.
Despite various differences, the structural similarities in fundamental conditions outweigh those differences. Looking at the past two decades, gold has proven to be a safe haven amid inflation, economic turmoil, crises of confidence, negative real interest rates, excessive money supply growth, and geopolitical tensions — all of which we are witnessing again in the 2020s.
Disclaimer: We provide all news, opinions, financial data, and other services based on the company’s policy aimed at serving customers. We are not responsible for any losses resulting from reliance on the information provided. Please be fully aware of the risks involved in trading in the financial markets.
Technical Analysis:
-
Developments in the first half of the 2020s support the theory that we are experiencing déjà vu — and that the 2020s may become the third golden decade. Gold has already reached historic highs across all currencies.
-
Looking at the second half of the previous two major gold bull markets, we observe remarkably similar price dynamics: In the 1970s, gold rose by 162%, and in the first decade of the 2000s, it increased by 150%. If the current cycle continues in the same pattern, gold could rise from $2,624 at mid-decade (end of December 2024) to around $6,800 by the end of the decade.
-
In our analysis, we sought to answer the question: Is gold currently undervalued?
-
We developed our own pricing models and, within our research department, we did the following:
-
Conducted a price comparison between current levels and the peaks of 2006, 2008, and 2011.
-
Calculated a 3-year moving average.
-
-
Why did we use a 3-year timeframe in our measurement tools?
-
For us, three years represent a medium-term market cycle for gold.
-
It reduces noise from short-term monthly volatility.
-
It helps identify periods when the price is above its average.
-
Historically, gold usually takes about 3 years to reverse its trend, as this reflects shifts in central bank policies and changes in global supply and demand.
-
Institutional liquidity: Hedge funds and central banks often base their investment strategies on 3-year cycles.
-
We applied mathematical modeling, and our standard deviation analysis showed that gold’s volatility becomes more normalized when measured over a 36-month period.
-
So, how was this measured, and what did we find…?
-
We used the prices of all major market peaks and compared each peak price to the 36-month historical monthly closing average — that is, a 3-year average — and we found the following:
-
In most cases, markets peaked when the price reached 1.60%–1.69% above the 3-year average. There were also hidden peaks around the 1.45% level.
Note:
The comparison was made using the peak price relative to the 36-month average of monthly closing prices.
-
In 2006, prices declined after reaching around 1.60%.
-
In 2008, prices dropped from around 1.65%.
-
In 2011, prices fell from around 1.69%.
-
These percentage levels acted as resistance to price movements, independent of chart-based technical analysis. Based on this, gold is not currently at its peak. If we consider the hidden resistance levels we uncovered, the following becomes clear:
-
If the 1.45% level is a strong resistance, it corresponds to around $3,800.
-
If prices are expected to retreat from the 1.69% level, then the target would be around $4,030 per ounce.
Conclusion:
Gold, based on its 3-year moving average, is not overpriced or at a peak. The pullback from $3,500 was corrective. We expect the uptrend to continue toward $3,600, then $3,800, and possibly reach $4,030.
-
Our long-term forecasts still indicate the possibility of gold prices rising to the levels of $3,700, possibly reaching $3,800, and even $4,000.
-
The timeframe expected by our research department is between September and October.
-
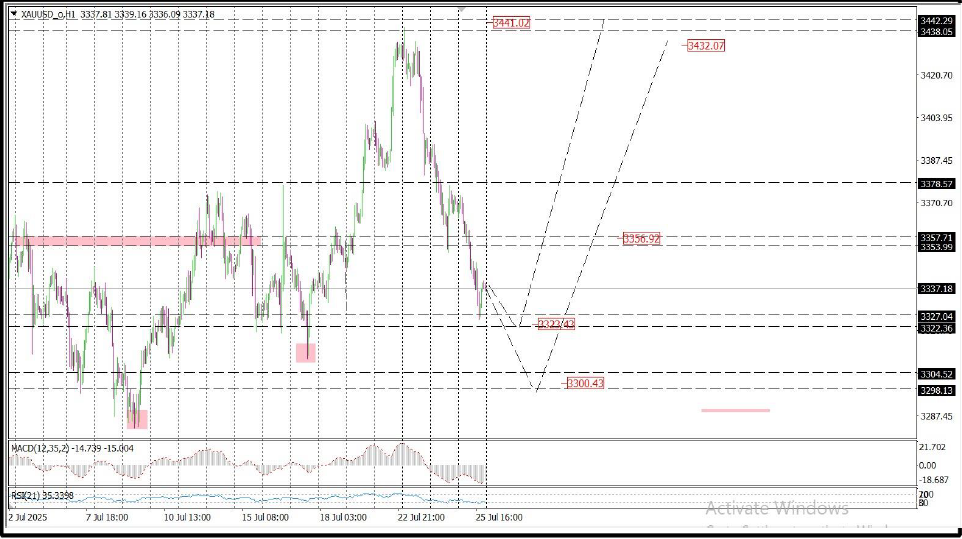
On the short-term level, we expect the following:
Prices may decline to around $3,327, with the final dip likely at $3,305,
followed by a rise to $3,350–$3,355,
then a drop to $3,330–$3,320,
and finally a rise to $3,375. -
This outlook would be invalidated if the price closes below $3,280.
Pivot Point: 3320
Resistance Level: 3400
Support Level: 3305
Disclaimer: We provide all news, opinions, financial data, and other services based on the company’s policy aimed at serving customers. We are not responsible for any losses resulting from reliance on the information provided. Please be fully aware of the risks involved in trading in the financial markets.
Add comment